Real-World Power BI Success Stories
Discover how our data-driven solutions have helped organizations transform reporting, optimize operations, and make smarter business decisions.
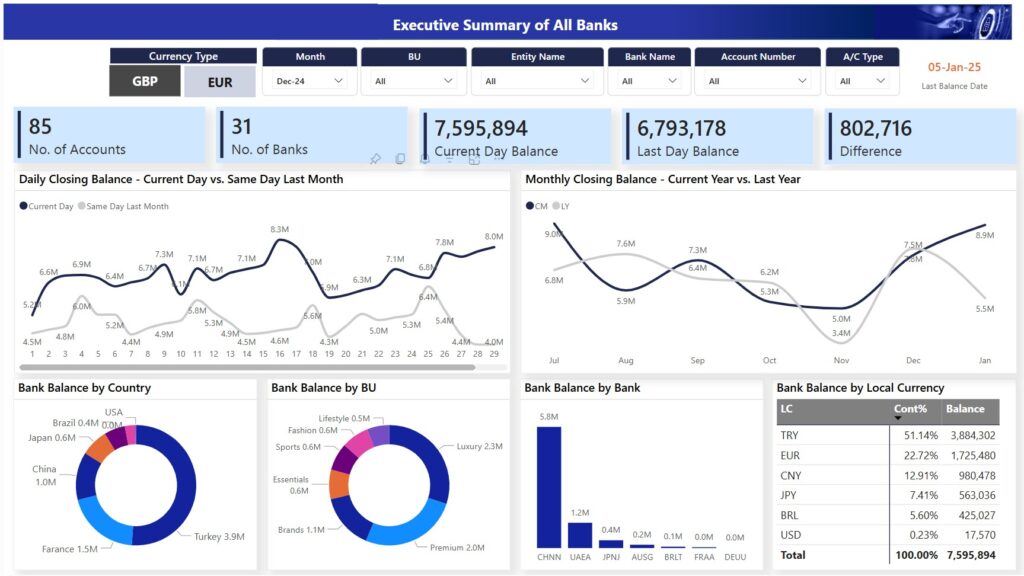
Case Study : Enhancing Treasury Management with Real-Time Financial Visibility
Introduction
Efficient treasury management is essential for ensuring a company’s financial stability, optimizing cash flow, and managing currency and liquidity risks. For businesses with multiple bank accounts across different countries, the complexity increases significantly, especially when real-time data is not easily available. One of our clients—a multinational retail company—faced such a challenge in consolidating and managing their global treasury operations.
Business Challenge
The client operated over 40 bank accounts across more than 10 countries. Despite having online access to their accounts, they struggled with:
- No centralized view of daily cash positions
- Limited visibility into liquidity trends and FX exposure
- Manual consolidation of bank statements in various formats
- Inability to track cash flow in real time or by currency
- Dependency on Excel files and human effort for updates
These limitations led to inefficient treasury decisions, delayed reporting, and increased financial risk.
Requirement
The client needed a robust, automated solution that could:
- Consolidate daily bank balances across all accounts
- Handle different bank statement formats and local currencies
- Standardize reporting in GBP and EUR
- Provide real-time visibility into cash positions and liquidity trends
- Allow the treasury and finance teams to monitor and analyze financial health quickly and easily
The Solution
We developed a Power BI-based Treasury Dashboard that automated the entire process from data extraction to visualization:
🔹 Data Integration via Power Query
- Built individual queries for each bank’s statement format
- Appended all bank data into a single model
- Applied transformations to extract only the latest transaction of each day
- Created a rolling date table to fill non-transactional days with the last known balance using
List.Dates()andFill Down
🔹 Currency Translation & Risk Metrics in DAX
- Added dynamic currency conversion logic using DAX measures and exchange rate tables
- Calculated daily and weekly liquidity metrics, FX exposure, and account-level summaries
- Developed flexible filters for analyzing balances by currency, country, and bank
🔹 Interactive Power BI Visuals
- Designed clean, intuitive dashboards with clear KPIs for:
- Real-time bank balances
- Liquidity forecasting
- Currency exposure
- Account-level tracking
Outcome
The dashboard became a game-changer for the treasury and finance teams:
✅ Real-time cash visibility across all global bank accounts
✅ Faster, more accurate decision-making with less manual input
✅ Reduced dependency on individual team members
✅ Improved reporting efficiency, saving hours of reconciliation work
✅ Increased confidence in managing liquidity and FX risk
The solution empowered the VP of Finance, Head of Treasury, and their teams to shift from reactive to proactive treasury management, with data available on demand through a centralized, automated platform.
Case Study : Streamlining Financial Performance Monitoring with an Automated P&L Dashboard
Introduction
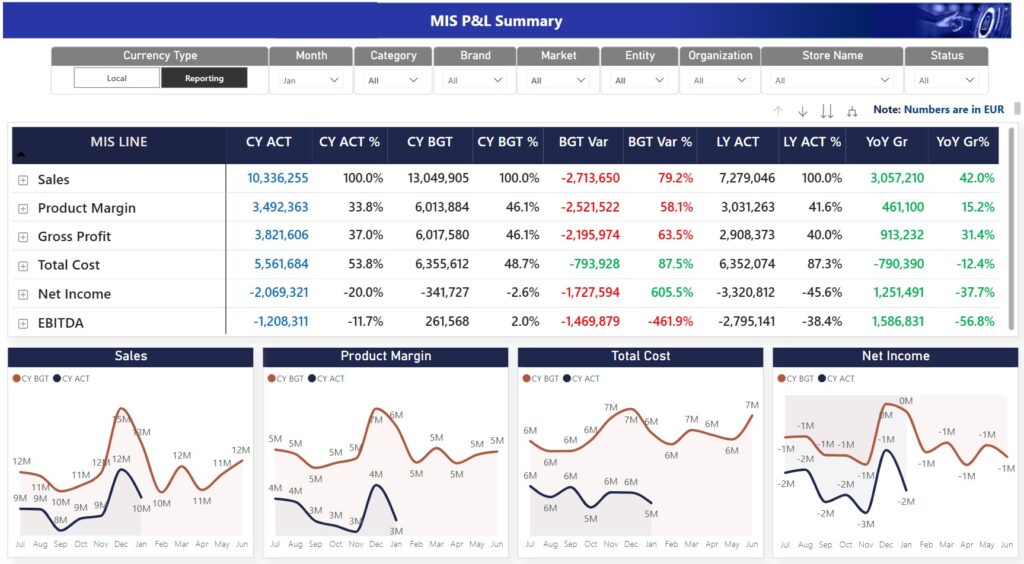
Accurate and timely financial performance monitoring is vital for any business aiming to drive profitability and make informed strategic decisions. A well-structured Profit & Loss (P&L) dashboard allows leadership to monitor key metrics, analyze variances, and allocate costs effectively. One of our clients—a mid-sized enterprise with multiple business units—faced difficulty in achieving real-time visibility into their financial performance due to manual processes and fragmented data.
Business Challenge
The organization faced several key issues:
- Manual allocation of back-office costs to business units led to inconsistencies
- Delayed financial reporting due to reliance on Excel-based processes
- Inability to track real-time profitability by product, department, or region
- Lack of dynamic filters and drill-down capabilities for variance analysis
- Decision-makers lacked a single source of truth for financial performance
These challenges hampered the leadership’s ability to respond quickly to operational and financial changes.
Requirement
The finance leadership required an automated and centralized solution that would:
- Consolidate revenue and expense data from multiple sources
- Automatically allocate shared and back-office costs using predefined logic
- Deliver real-time P&L insights with drill-down and filtering options
- Highlight variance trends against budgets and forecasts
- Be easy to maintain and refresh without technical expertise
The Solution
We built a scalable and fully automated Power BI P&L Dashboard that transformed static financial reports into an interactive, real-time performance monitoring tool.
🔹 Data Modeling and Automation
- Connected multiple data sources, including ERP exports and Excel templates
- Applied allocation logic in Power Query and DAX for distributing back-office costs
- Created a robust data model to track profitability across key dimensions: business unit, product, location, and time
🔹 Interactive Reporting and Variance Analysis
- Developed a clean, intuitive layout to reflect actuals vs. budget with variance highlights
- Enabled dynamic filtering by department, period, or cost center
- Included key financial KPIs, such as:
- Gross Margin
- Operating Profit
- Contribution by Product Line
- Budget vs. Actual variance %
🔹 Automation and Maintenance
- Implemented scheduled data refreshes through Power BI Service
- Designed the dashboard for non-technical users to interact with data without needing support from IT
Outcome
The Power BI P&L Dashboard significantly improved the client’s ability to manage financial performance:
✅ Automated cost allocation eliminated manual errors and saved time
✅ Real-time visibility into profitability helped leadership take faster actions
✅ Drill-down capabilities enabled precise root cause analysis of variances
✅ Consistent reporting structure across departments ensured transparency
✅ Improved collaboration between finance and business units
This solution empowered senior management to shift from retrospective reporting to real-time financial monitoring and forward-looking decision-making.
“This dashboard transformed our financial reviews from historical debates to forward-looking strategy sessions.” — CFO
Case Study : Transforming Retail Operations with Real-Time Performance Analytics
Introduction
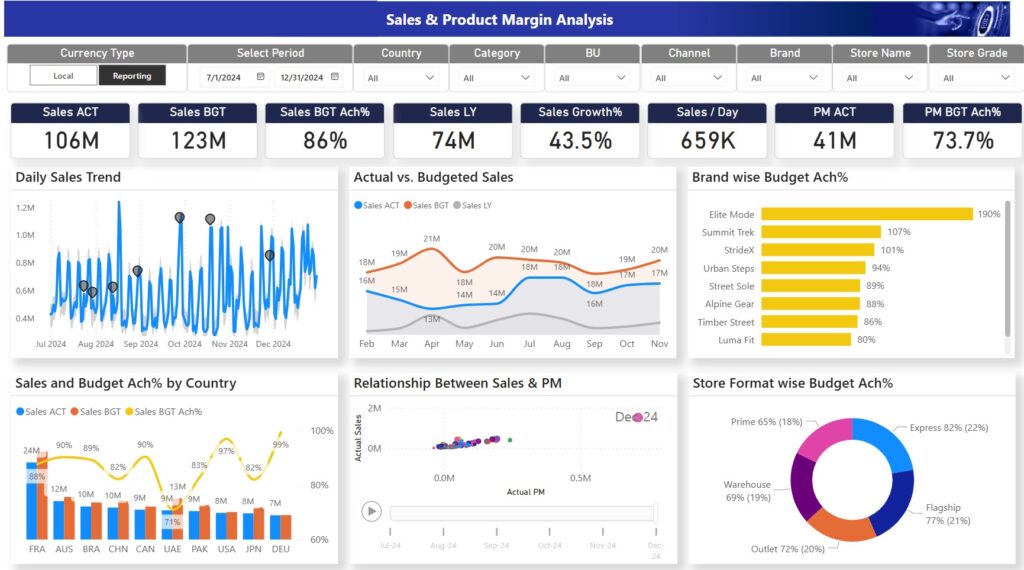
In the fast-paced world of retail, having real-time visibility into sales, store performance, and operational KPIs is crucial for staying competitive. To support data-driven decisions across multiple locations, we developed a Retail Performance Dashboard that tracks sales, margins, store efficiency, and budget variances. This solution enables retail leadership to make timely, informed decisions at both strategic and operational levels.
Business Challenge
The client—a national retail chain with dozens of locations—faced several challenges in monitoring and managing performance effectively:
- Manual, time-consuming processes for consolidating sales and headcount data
- No real-time insights into budget vs. actual performance
- Limited visibility into store-level efficiency metrics
- Inconsistent reporting formats across departments
- Difficulty analyzing historical trends and year-over-year performance
As a result, decision-makers lacked a unified view to assess performance or intervene promptly.
Requirement
The client needed a solution that would:
- Provide a centralized view of sales, margin, and budget performance
- Track store-level metrics like footfall, headcount, and efficiency ratios
- Compare actual performance against budget and prior year
- Deliver real-time data to regional managers, finance, and operations teams
- Enable drill-down and filtering by store, region, date, and product category
The Solution
We delivered an interactive and scalable Power BI Retail Dashboard that empowered all levels of management with timely and actionable insights.
🔹 Automated Data Consolidation
- Integrated multiple data sources including POS systems, HR headcount reports, and budgeting spreadsheets
- Automated the transformation and consolidation of data using Power Query
- Applied business rules to align sales, HR, and budget data for consistent reporting
🔹 Dynamic Retail KPIs and Visuals
- Created visuals and KPIs for:
- Daily and monthly sales performance
- Budget vs. actual variances
- Store-wise profitability
- Headcount vs. store sales ratio
- YOY comparisons with interactive filters
- Enabled drill-down from total company performance to individual store level
🔹 Performance Monitoring Tools
- Developed custom DAX measures to monitor:
- Contribution margins
- Store productivity (sales per employee)
- Store performance trend vs. budget and last year
- Provided dashboard bookmarks for quick access to common views (e.g., underperforming stores)
Outcome
The Power BI Retail Dashboard delivered significant operational and strategic benefits:
✅ Real-time visibility into performance across all stores
✅ Streamlined reporting, reducing manual effort and report turnaround time
✅ Improved budget tracking and variance analysis
✅ Better store-level decision-making through automated headcount monitoring
✅ Empowered retail managers and leadership with data to improve profitability and efficiency
With this solution, the client transformed their traditional reporting into a modern, insights-driven performance management system, enabling them to stay agile and proactive in a competitive retail landscape.
“The dashboard has revolutionized our retail operations—we now make decisions based on live data rather than guesswork.” — Retail Operations Director
Case Study : Building a Decision Support System for Raw Material Imports
Introduction
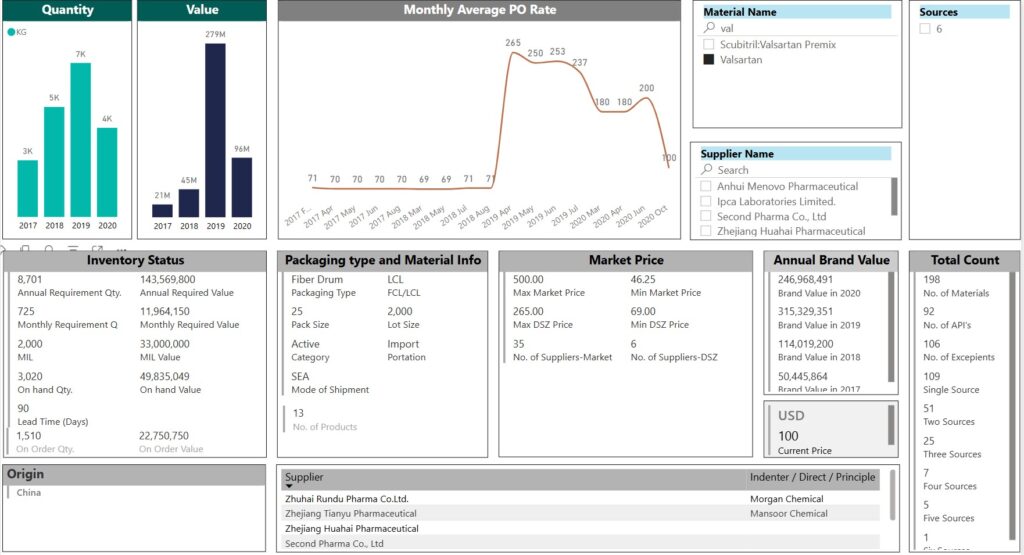
Importing raw materials efficiently requires clear visibility into internal demand, supplier lead times, inventory levels, and competitor pricing. A leading manufacturing company approached us to address their growing challenges in managing procurement decisions due to a lack of centralized data and decision-making tools. We developed a Power BI-based Decision Support System (DSS) that transformed their procurement process from reactive to proactive.
Business Challenge
The client faced multiple bottlenecks in their raw material import planning and sourcing process:
- No visibility into internal consumption trends or production forecasts
- Scattered data on current stock levels across warehouses
- Lack of insight into supplier lead times and availability
- No access to competitor pricing trends for benchmarking
- Decisions were being made using spreadsheets and emails, causing delays and cost inefficiencies
These challenges led to stockouts, over-ordering, missed savings opportunities, and a lack of strategic control over procurement.
Requirement
The company required a dynamic decision support system that would:
- Consolidate and visualize internal material consumption and projected requirements
- Track current inventories across all plants and warehouses
- Integrate supplier data including pricing, delivery times, and source count
- Compare and monitor competitor pricing for key raw materials
- Support scenario planning and cost-benefit analysis for procurement decisions
The Solution
We developed a Power BI-driven Decision Support System that offered a 360-degree view of the raw material procurement landscape.
🔹 Integrated Data Model
- Pulled data from ERP systems, inventory reports, supplier databases, and competitor pricing feeds
- Modeled consumption forecasts using historical trends and production schedules
- Created unified datasets for supplier performance, pricing, and delivery lead times
🔹 Interactive Dashboards for Decision Makers
- Built role-specific dashboards for Procurement, Finance, and Operations
- Key metrics included:
- Current stock vs. forecasted need
- Supplier lead time analysis
- Vendor count by material
- Import cost analysis per vendor
- Competitor price benchmarking
🔹 Scenario Planning and What-If Analysis
- Used DAX and parameter inputs to support decision-making under different scenarios:
- What if we delay the order by a week?
- What if we split the order between two vendors?
- How does switching to a new supplier impact the landed cost?
Outcome
The implementation of this Decision Support System brought measurable improvements in procurement strategy and operational control:
✅ Enhanced visibility across the supply chain
✅ More accurate demand forecasting and inventory planning
✅ Faster, data-driven sourcing decisions with reduced risk of stockouts or overstocking
✅ Better supplier negotiation through visibility into lead times and pricing
✅ Proactive cost management by comparing historical and competitor prices
The Power BI-based DSS empowered the procurement team to shift from reactive coordination to strategic sourcing and supply chain optimization, ultimately reducing costs and improving service levels.