Introduction to DAX: The Language Behind Power BI Magic.
For anyone beginning their journey with Power BI, the term DAX (Data Analysis Expressions) is bound to come up early — and for good reason. DAX is the core formula language that powers data modeling and calculations in Power BI, enabling users to turn raw data into actionable insights.
While it shares similarities with Excel formulas, DAX is far more robust, designed specifically for building advanced analytical logic across large and complex datasets.
In this article, Tecrionix introduces the fundamentals of DAX and its critical role in Power BI.
In this post, we’ll cover:
- What DAX is
- Why it’s essential in Power BI
- Key DAX concepts for beginners
- A few simple examples to get you started
What Is DAX?
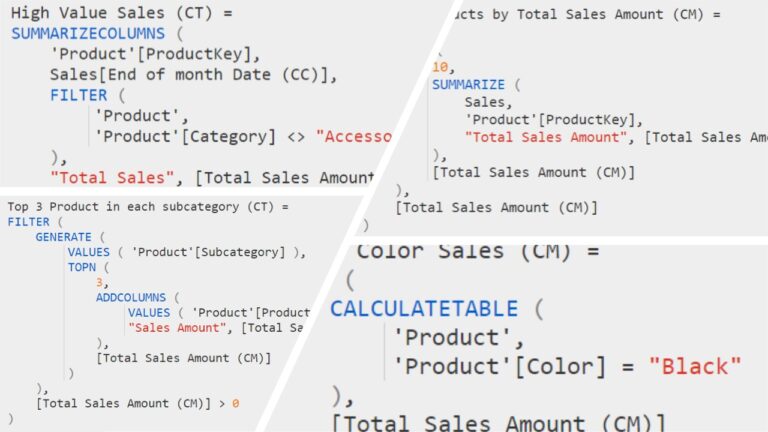
DAX is the language used to create calculated columns, measures, and calculated tables in Power BI, Excel Power Pivot, and Analysis Services Tabular models. It’s designed to work with data models and can handle both row-level and aggregate-level calculations.
Imagine DAX as the logic layer of your Power BI reports. While Power Query prepares and transforms your data, DAX is responsible for performing dynamic calculations that drive visuals and KPIs.
Why Is DAX Important?
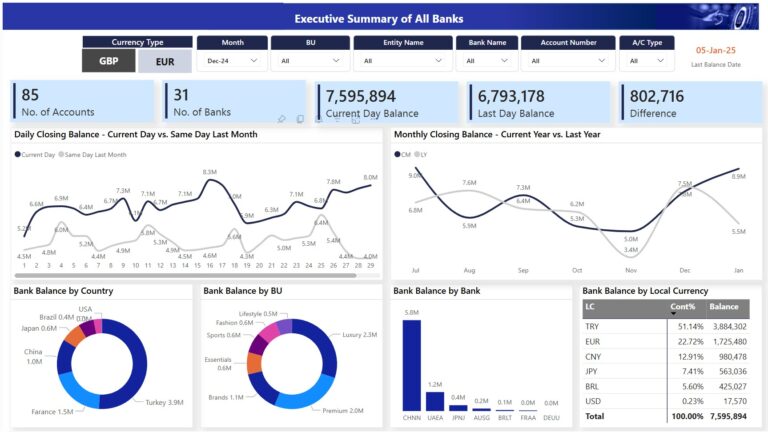
Power BI is a powerful visualization tool — but the real value comes when you create custom calculations that turn raw data into insights. DAX allows you to:
- Create KPIs like year-over-year growth or rolling averages
- Filter data dynamically based on slicers or user interaction
- Perform time intelligence (e.g., calculating last month’s sales)
- Build logic for conditional formatting or trend analysis
Without DAX, Power BI would be limited to basic aggregations like sum, count, or average.
Key Concepts in DAX
Here are some fundamental ideas that every DAX beginner should understand:
1. Calculated Columns vs Measures
- Calculated columns are added to tables and calculated row-by-row at data refresh time. They can be used in visuals like any other column.
- Measures are dynamic calculations evaluated in real-time based on filters and slicers in the report.
Use measures whenever possible, as they are more efficient and flexible.
2. Filter Context and Row Context
These two concepts are essential for understanding how DAX evaluates formulas:
- Row context exists when DAX is evaluating one row at a time (e.g., in a calculated column).
- Filter context is defined by slicers, filters, and visuals — it affects how measures are calculated.
Understanding the difference is key to writing correct DAX formulas.
3. Context Transition
When a row context becomes a filter context — usually when using functions like CALCULATE() — this is called context transition. It’s a crucial DAX behavior that often confuses beginners.
Simple DAX Functions to Know
Here are a few easy-to-understand DAX functions that are great for beginners:
SUM(Sales[Amount])– Adds up all values in theAmountcolumn.AVERAGE(Sales[Amount])– Calculates the average of the column.DISTINCTCOUNT(Customer[CustomerID])– Counts unique customers.CALCULATE(SUM(Sales[Amount]), Region[Name] = "West")– Filters and then sums values.
Getting Started with Your First Measure
Let’s say you want to calculate Total Sales in your model. You can create a measure like this:
Total Sales = SUM(Sales[Amount])
If you now place this measure into a visual and slice it by region or product, it will dynamically adjust — this is the power of filter context at work.
Now let’s create a simple profit measure:
Profit = SUM(Sales[Amount]) - SUM(Sales[Cost])
Want to take it a step further? Calculate Profit Margin:
Profit Margin = DIVIDE([Profit], [Total Sales], 0)
The DIVIDE() function is a safer alternative to standard division as it handles divide-by-zero errors gracefully.
Conclusion
DAX might look intimidating at first, but once you grasp the basics — especially the difference between calculated columns and measures, and how context works — you’ll be able to unlock a whole new level of analysis in Power BI.
Start small. Experiment. And gradually work your way up to more advanced functions like CALCULATE(), FILTER(), and time intelligence functions like TOTALYTD().
If you’re serious about becoming a Power BI expert, learning DAX is not optional — it’s essential.
Next Steps:
- Check out our upcoming blog: “Understanding Filter Context in DAX with Examples”
- Join our free Power BI training session to practice DAX live
- Contact us if your team needs hands-on DAX workshops or consulting
At Tecrionix, we provide expert-led Power BI training and consulting services to help professionals and organizations build high-performance dashboards and data models. Whether you’re just starting out or looking to enhance your data visualizations, DAX measures, and Power Query transformations, our tailored solutions are designed to meet your needs. We deliver practical, hands-on training and end-to-end dashboard development for clients across Pakistan, the UAE, Saudi Arabia, Qatar, and beyond. If you’re ready to elevate your Power BI capabilities, connect with us to explore how Tecrionix can support your journey.


