Mastering DAX Table Functions in Power BI.
At Tecrionix, we empower professionals to build smarter, insight-driven reports using advanced Power BI techniques. One crucial skill in this journey is mastering DAX table functions. Understanding how to use them effectively can unlock powerful ways to shape, filter, and transform your data.
In this blog, we will explore five essential DAX table functions—SUMMARIZE, SUMMARIZECOLUMNS, ADDCOLUMNS, FILTER, and CALCULATETABLE—with standalone examples and more advanced usage where they are used together.
These functions allow you to create virtual tables that feed into measures, calculated tables, and visuals—giving you total control over how your data is presented and analyzed.
1. SUMMARIZE – Grouping and Aggregation
The SUMMARIZE function is used to group data by one or more columns and optionally add calculated expressions.
Standalone Example:
SUMMARIZE(
    Sales,
    Sales[ProductCategory],
    Sales[Region],
    "Total Sales", SUM(Sales[Amount])
)
This will create a table showing the total sales amount for each combination of Product Category and Region.
Used Together with ADDCOLUMNS:
ADDCOLUMNS(
    SUMMARIZE(Sales, Sales[CustomerID]),
    "Average Sales", AVERAGE(Sales[Amount])
)
Here, SUMMARIZE groups by CustomerID, and then ADDCOLUMNS adds a new column with the average sales per customer.
2. SUMMARIZECOLUMNS – Optimized for Measures and Filters
SUMMARIZECOLUMNS is similar to SUMMARIZE but designed for better performance, especially with filter context. It doesn’t rely on the current row context and handles relationships and slicers more naturally.
Standalone Example:
SUMMARIZECOLUMNS(
    Sales[Region],
    "Total Profit", SUM(Sales[Profit])
)
This table shows total profit per region, automatically respecting any report-level or visual filters.
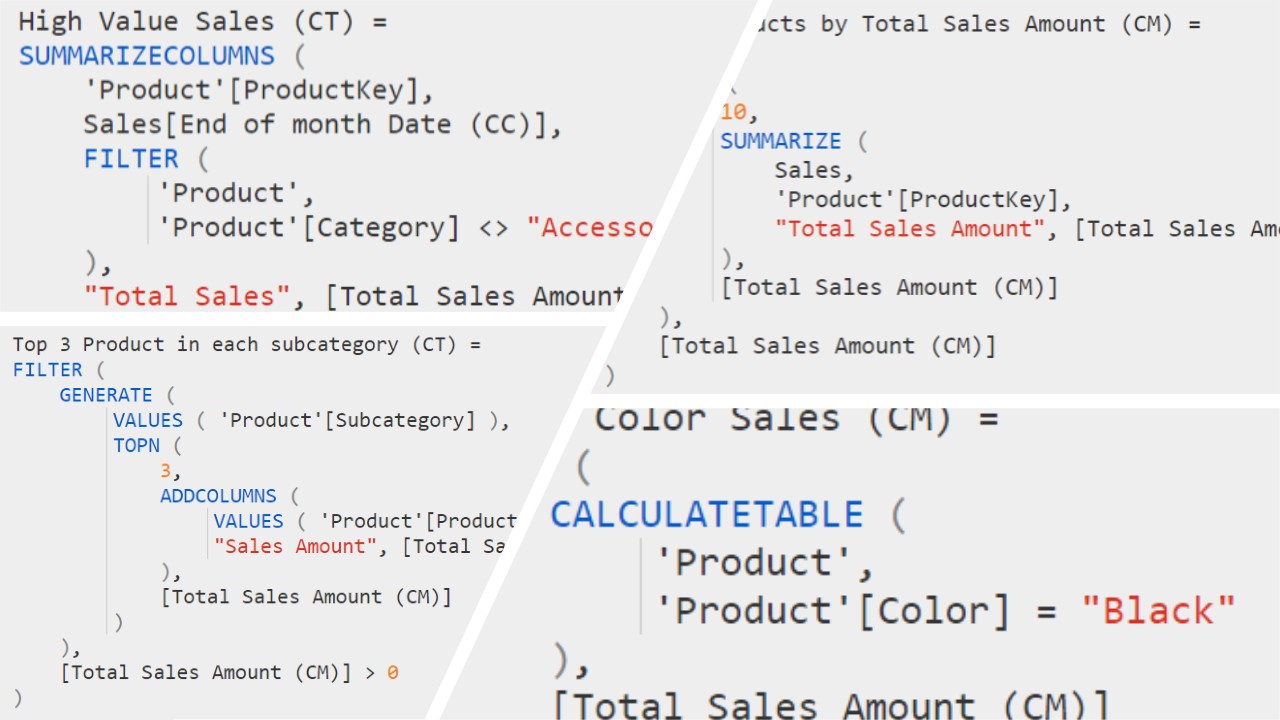
Used Together with FILTER:
SUMMARIZECOLUMNS(
    Sales[Product],
    FILTER(
        ALL(Sales),
        Sales[Amount] > 1000
    ),
    "High Value Sales", SUM(Sales[Amount])
)
This summarizes high-value sales above 1000 by product, ignoring visual filters via ALL().
3. ADDCOLUMNS – Add Calculated Columns to a Table
ADDCOLUMNS takes a table and adds one or more calculated columns to it.
Standalone Example:
ADDCOLUMNS(
    VALUES(Sales[Product]),
    "Sales Count", CALCULATE(COUNTROWS(Sales))
)
This generates a list of products and how many times each was sold.
Used Together with CALCULATETABLE:
ADDCOLUMNS(
    CALCULATETABLE(
        VALUES(Sales[Product]),
        Sales[Amount] > 500
    ),
    "High Sales Count", CALCULATE(COUNTROWS(Sales))
)
Here, CALCULATETABLE filters to only products with high sales, and ADDCOLUMNS calculates how many times each appears.
4. FILTER – Apply Row-Level Filtering
FILTER returns a table that includes only rows that meet a condition.
Standalone Example:
FILTER(
    Sales,
    Sales[Amount] > 1000 && Sales[Region] = "Europe"
)
This returns all rows in the Sales table where the amount is over 1000 and the region is Europe.
Used Together with SUMMARIZE:
SUMMARIZE(
    FILTER(Sales, Sales[Amount] > 1000),
    Sales[CustomerID],
    "Total High Sales", SUM(Sales[Amount])
)
This groups only high-value sales by customer.
5. CALCULATETABLE – Evaluate an Expression in a Modified Filter Context
CALCULATETABLE is one of the most powerful DAX functions. It evaluates a table expression under modified filters.
Standalone Example:
CALCULATETABLE(
    Sales,
    Sales[Country] = "UK"
)
Returns all rows where the country is UK.
Used Together with ADDCOLUMNS:
ADDCOLUMNS(
    CALCULATETABLE(
        VALUES(Sales[Product]),
        Sales[Date] >= DATE(2024,1,1)
    ),
    "YTD Sales", CALCULATE(SUM(Sales[Amount]))
)
This gives you a product list with year-to-date sales from January 1, 2024.
Final Thoughts
Learning to work with table functions in DAX opens up a whole new level of control in Power BI. These functions are not only useful for building calculated tables, but also for debugging complex models, writing custom measures, and generating intermediate result sets.
Understanding how to combine them allows you to answer more complex business questions such as:
- What’s the average sale per product category in a specific region?
- Which customers contributed to sales above a threshold last month?
- How do different segments perform over time based on custom filters?
These questions can all be addressed through smart use of SUMMARIZE, SUMMARIZECOLUMNS, ADDCOLUMNS, FILTER, and CALCULATETABLE.
At Tecrionix, we help organizations harness the full power of DAX and Power BI to build truly intelligent reporting systems. Whether you’re aiming to optimize performance with advanced DAX techniques, create robust data models, or train your team to think in terms of data logic and efficiency, our consulting and training services are designed for impact. Serving clients across Pakistan, UAE, Saudi Arabia, Qatar, Bahrain, Oman, Kuwait and beyond, we bring hands-on expertise in DAX, Power Query, and business intelligence strategy. Let’s work together to transform how your business uses data—reach out to explore how Tecrionix can elevate your Power BI capabilities.