Creating a Treasury Dashboard in Microsoft Power BI: A Real-World Solution
In today’s fast-paced financial environment, effective treasury management is no longer optional — it’s critical to business stability and decision-making. Yet many organizations still lack a structured, real-time reporting system to manage global cash positions efficiently.
This article shares our practical experience at Tecrionix implementing a comprehensive Treasury Dashboard using Microsoft Power BI for a major retail client operating across more than 10 countries, with over 40 active bank accounts.
The objective was to design a centralized, automated dashboard that delivers daily visibility into global cash balances, empowering the finance team with timely, actionable insights. The result? A scalable, user-friendly solution that significantly reduced manual effort and enhanced reporting accuracy — and it’s exactly the kind of solution Tecrionix can build for your business.
The Challenge
The company had online access to all its banks and could download bank statements in Excel format. However, there were several challenges that made manual consolidation and analysis inefficient and error-prone:
- Inconsistent Bank Formats: Every bank provided its statement in a different layout and structure.
- Multiple Transactions per Day: For reporting, only the last transaction of the day was relevant to reflect the ending balance.
- Non-Transactional Days: There were days without any transactions, but balances needed to be carried forward for continuous tracking.
- Multiple Currencies: Bank accounts operated in various local currencies, but consolidated reporting was required in GBP and EUR.
This is a classic example where Power BI—and more specifically, Power Query and DAX—can transform scattered data into insightful reporting.
The Solution — Built in Power BI Desktop
🛠 Power Query Magic
The backbone of this dashboard was Power Query, which enabled me to transform and normalize data from all banks regardless of their format.
Here’s what I did:
- Individual Queries for Each Bank: I created separate queries to clean and format each bank’s statement. This included renaming columns, ensuring consistent date formats, and selecting relevant fields (like transaction date, amount, and balance).
- Appended Queries: All individual queries were appended into a unified table using Power Query’s Append Queries functionality.
- Index and Max Logic: To capture only the last transaction of the day, I added an Index Column sorted by transaction date and time, and then filtered for the maximum index per day.
- Vertical Calendar Table: A daily snapshot was essential. I created a dynamic calendar using this powerful Power Query function: mCopyEdit
{Number.From([#"Start Date"])..Number.From([#"End Date"])}This allowed me to create a continuous list of dates from the account’s opening to the present day. - Filling Gaps (Non-Transactional Days): By merging the daily calendar with actual transactions and using Fill Down, I ensured that the last known balance was carried forward when no new transactions occurred.
This snapshot table was the core of my reporting model—clean, consistent, and ready for analysis.
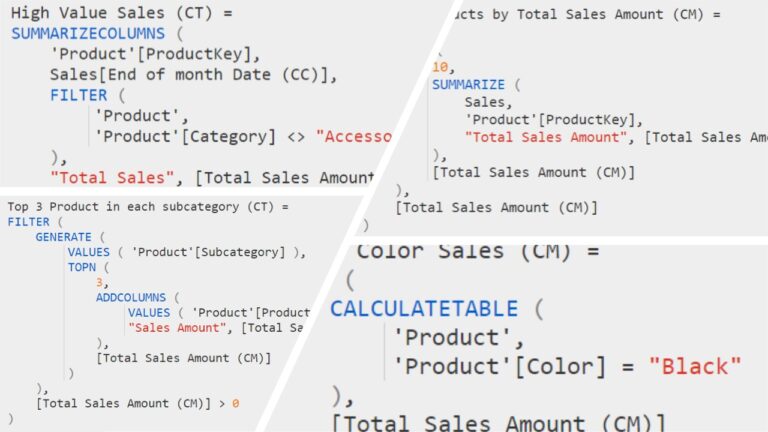
📊 DAX for Analysis & Currency Translation
Once the data model was established, I leveraged DAX to create insightful calculations and metrics:
- Currency Translation: Using exchange rate tables and calculated columns/measures, I translated all local currency balances into GBP and EUR based on reporting requirements.
- Daily, Weekly, and Monthly Trends: Custom measures allowed for tracking balances across different time frames, enabling both short-term and long-term liquidity planning.
- Aggregation by Bank, Country, or Currency: Slicers and filters made it easy to zoom into specific bank accounts, countries, or currencies as needed.
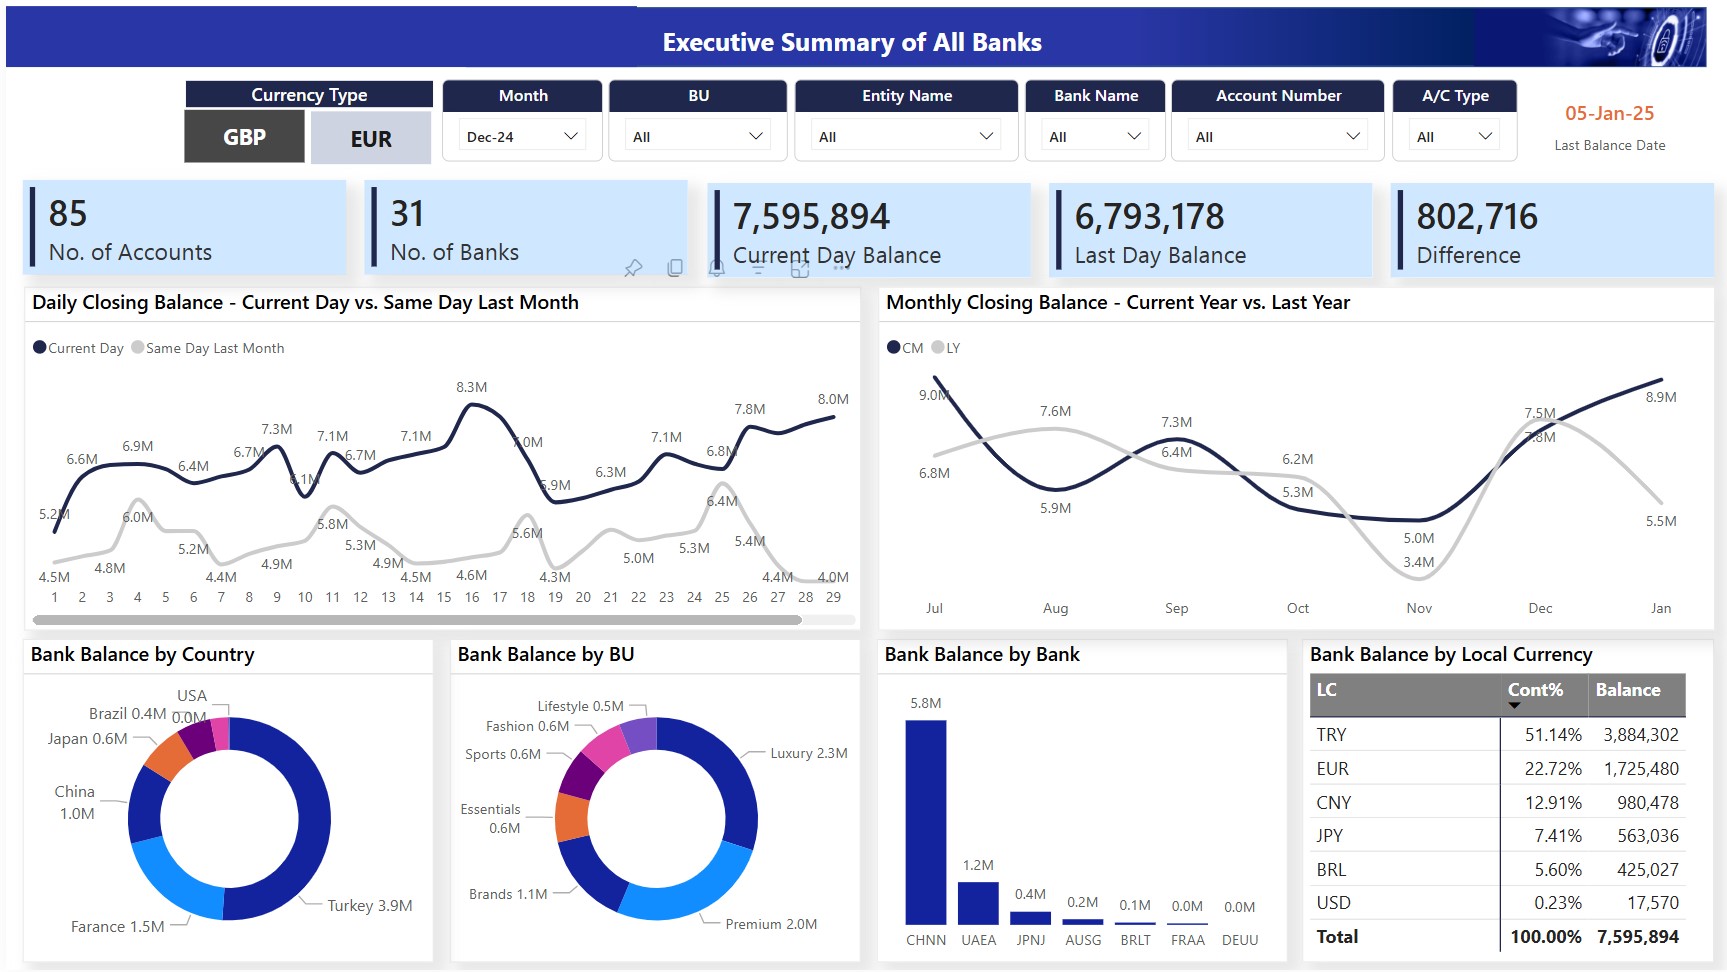
The Impact
What started as a disorganized stack of Excel files turned into a dynamic and interactive Power BI dashboard that empowered both the VP of Finance and the Head of Treasury to:
- View consolidated cash positions in real-time
- Plan liquidity with better confidence
- Eliminate repetitive manual reporting tasks
- Improve operational efficiency across treasury teams
Not only was this dashboard an automation success, but it also became a strategic tool for financial decision-making. The dependency on individual team members was significantly reduced, and decision-makers had data at their fingertips—anytime, anywhere.
Final Thoughts
This experience proved how powerful Microsoft Power BI can be when used creatively and effectively. Power Query handled the data transformation challenges beautifully, while DAX delivered rich insights. For companies dealing with multi-bank, multi-currency scenarios—especially those without formal treasury systems—Power BI can fill a critical gap.
If you’re a finance professional looking to streamline treasury reporting, consider starting with Power BI. With the right structure and approach, it can deliver immense value without requiring heavy IT infrastructure.
At Tecrionix, we specialize in Power BI consulting and training services for businesses across industries. Whether you’re looking to build advanced dashboards like the Treasury Dashboard in Power BI, streamline your financial reporting, or empower your team with hands-on Power BI training, we can help. Our expert-led training programs and consulting services are available in Pakistan, UAE, Saudi Arabia, Qatar, and other countries. With deep expertise in Power Query, DAX, data modeling, and business intelligence solutions, we help organizations turn data into actionable insights. Contact us to learn how we can support your Power BI journey—from dashboard development to upskilling your team.