Introduction
A mid-sized enterprise with several business units relied on Excel to produce its P&L. Reports were slow, cost allocation was inconsistent, and management could not see profitability by product, department or region.
Business challenge
- Back-office costs allocated manually and inconsistently
- Reporting delayed by Excel-based processes
- No real-time view of profitability by product, department or region
- No filters or drill-down for variance analysis
- No single source of truth for financial performance
Requirements
- Consolidate revenue and expense data from multiple sources
- Allocate shared and back-office costs automatically, using agreed rules
- A real-time P&L with drill-down and filters
- Variance trends against budgets and forecasts
- Easy to maintain without technical expertise
The solution
Data modeling
- ERP exports and Excel templates brought into one model
- Cost allocation logic built into Power Query and DAX
- Model organized by business unit, product, location and time
Reporting
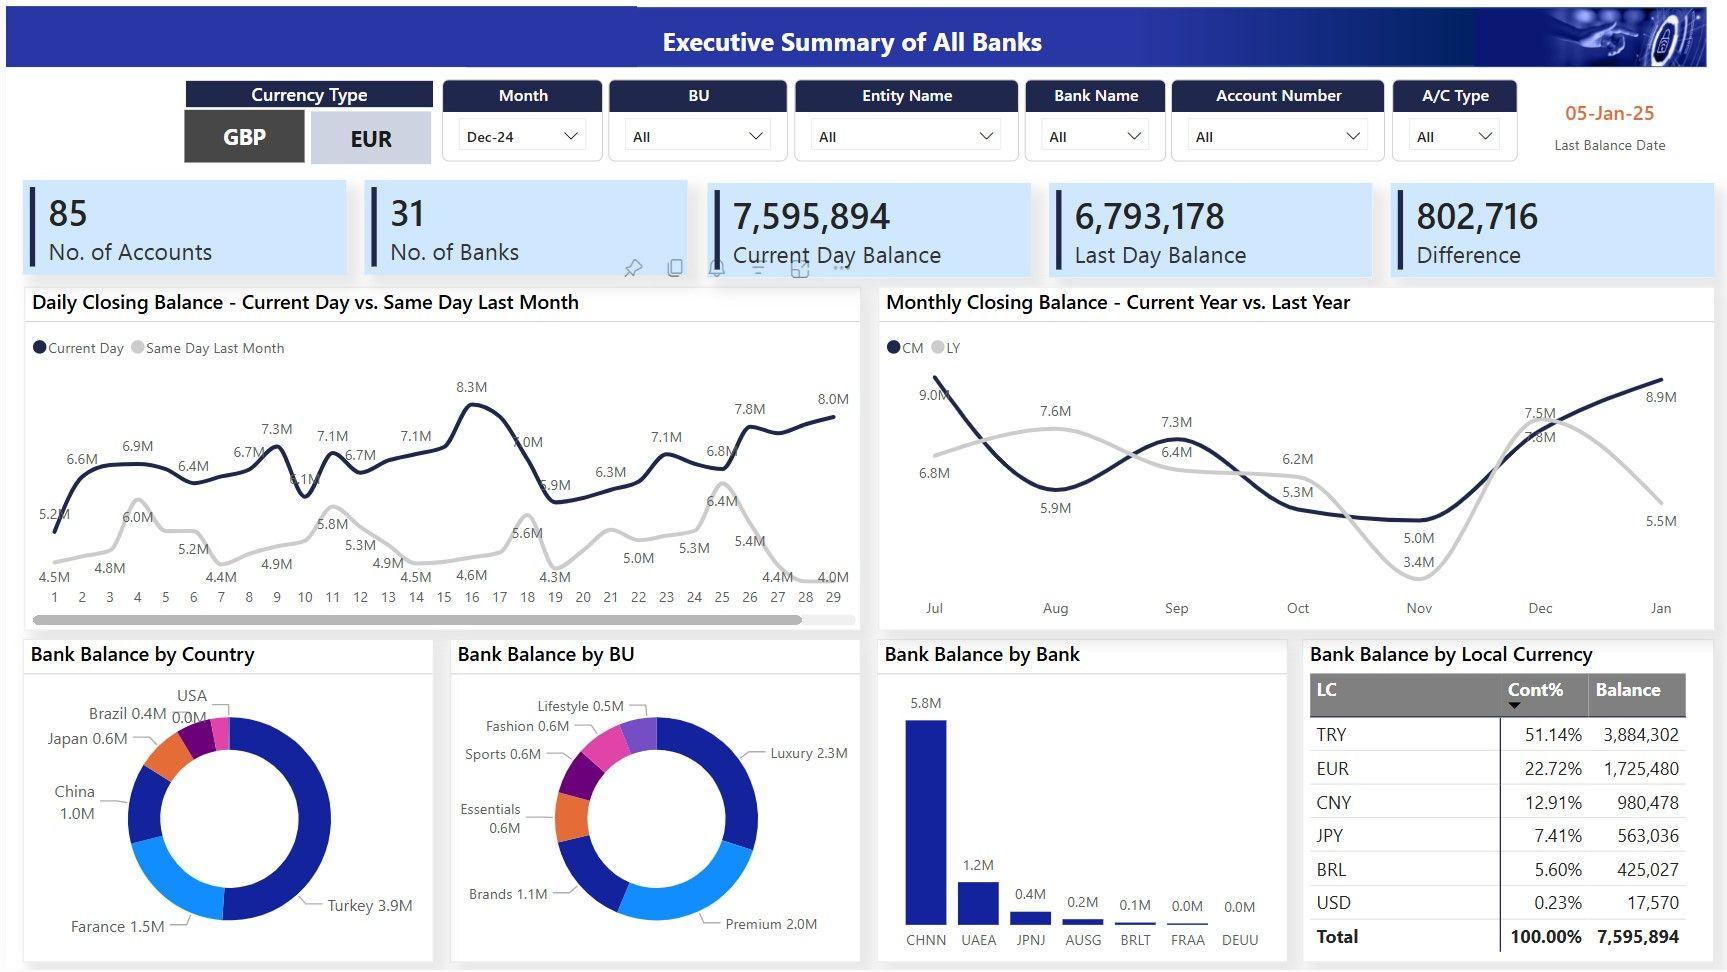
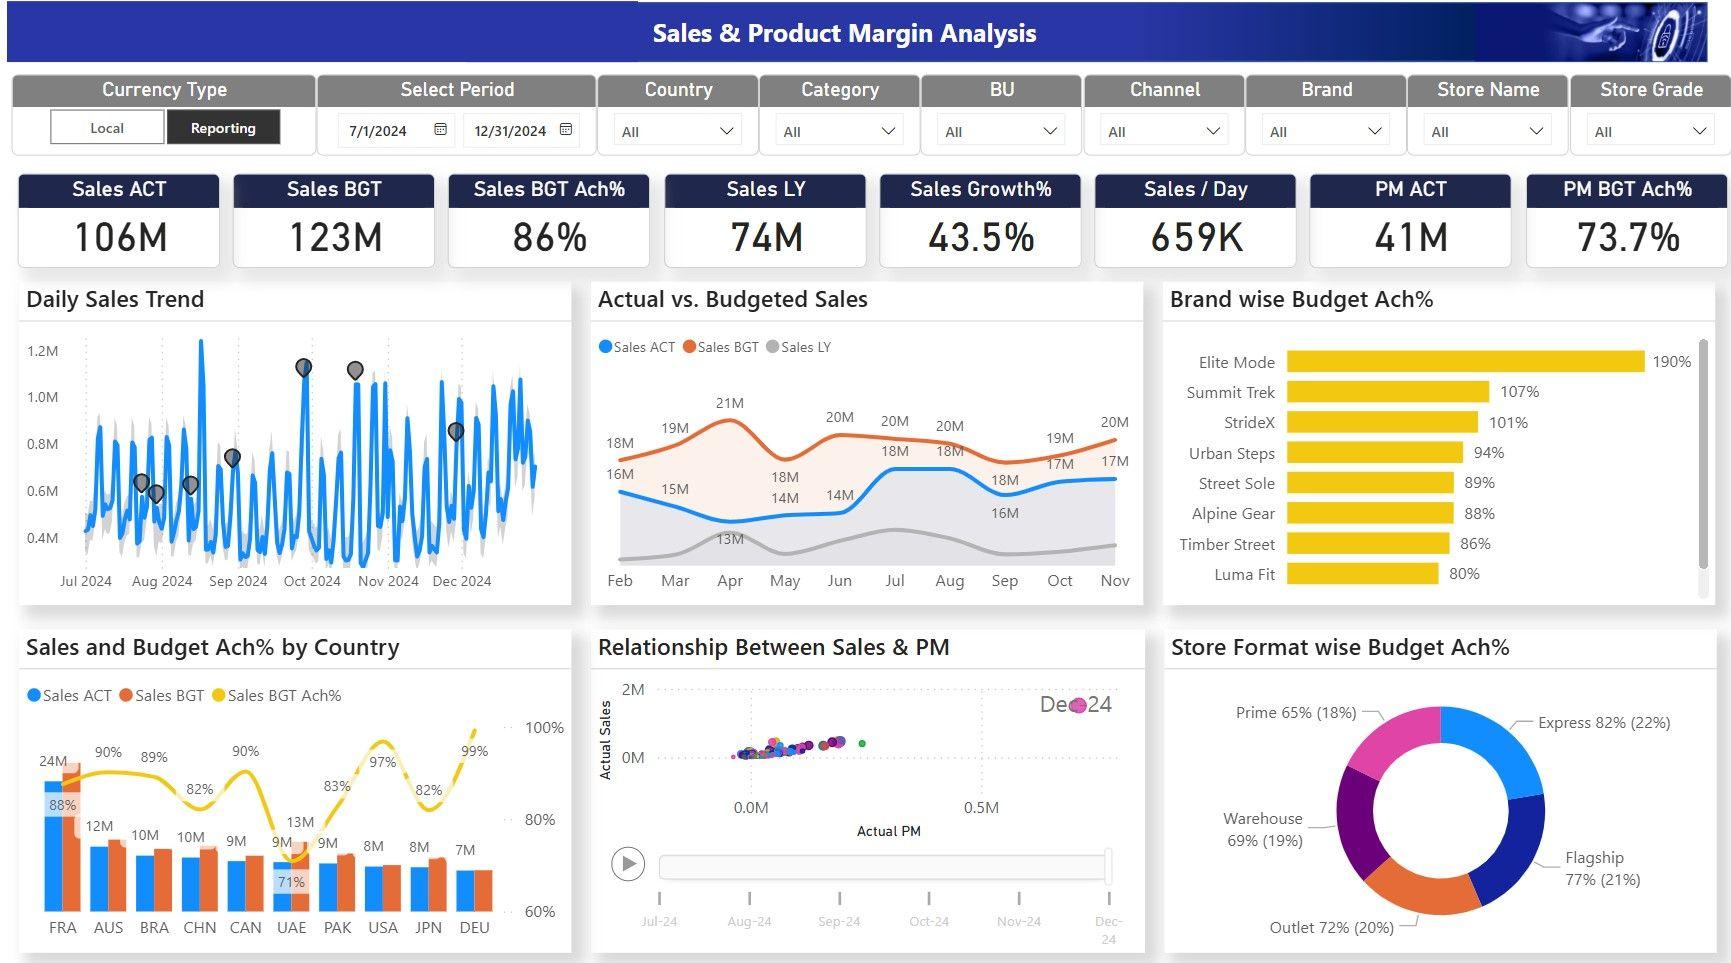
- Actuals vs budget and last year, with variance highlights
- Dynamic filters by department, period, brand, market and cost center
- KPIs: gross margin, operating profit, net income, EBITDA and budget variance %
Automation
- Scheduled refresh in the Power BI Service
- Designed for non-technical finance users
Outcome
- Automated cost allocation removed manual errors and saved time
- Real-time profitability visibility
- Drill-down for root-cause variance analysis
- Consistent reporting across departments
- Better collaboration between finance and the business
“This dashboard transformed our financial reviews from historical debates to forward-looking strategy sessions.”
Tools used
- Power BI
- Power Query
- DAX
- Power BI Service