Introduction
A retail chain with dozens of stores consolidated sales and headcount data by hand. Regional managers, finance and operations had no live view of performance against budget or last year.
Business challenge
- Sales and headcount data consolidated manually
- No real-time budget vs actual tracking
- Limited visibility of store efficiency
- Inconsistent report formats across teams
- Hard to analyze historical and year-on-year trends
Requirements
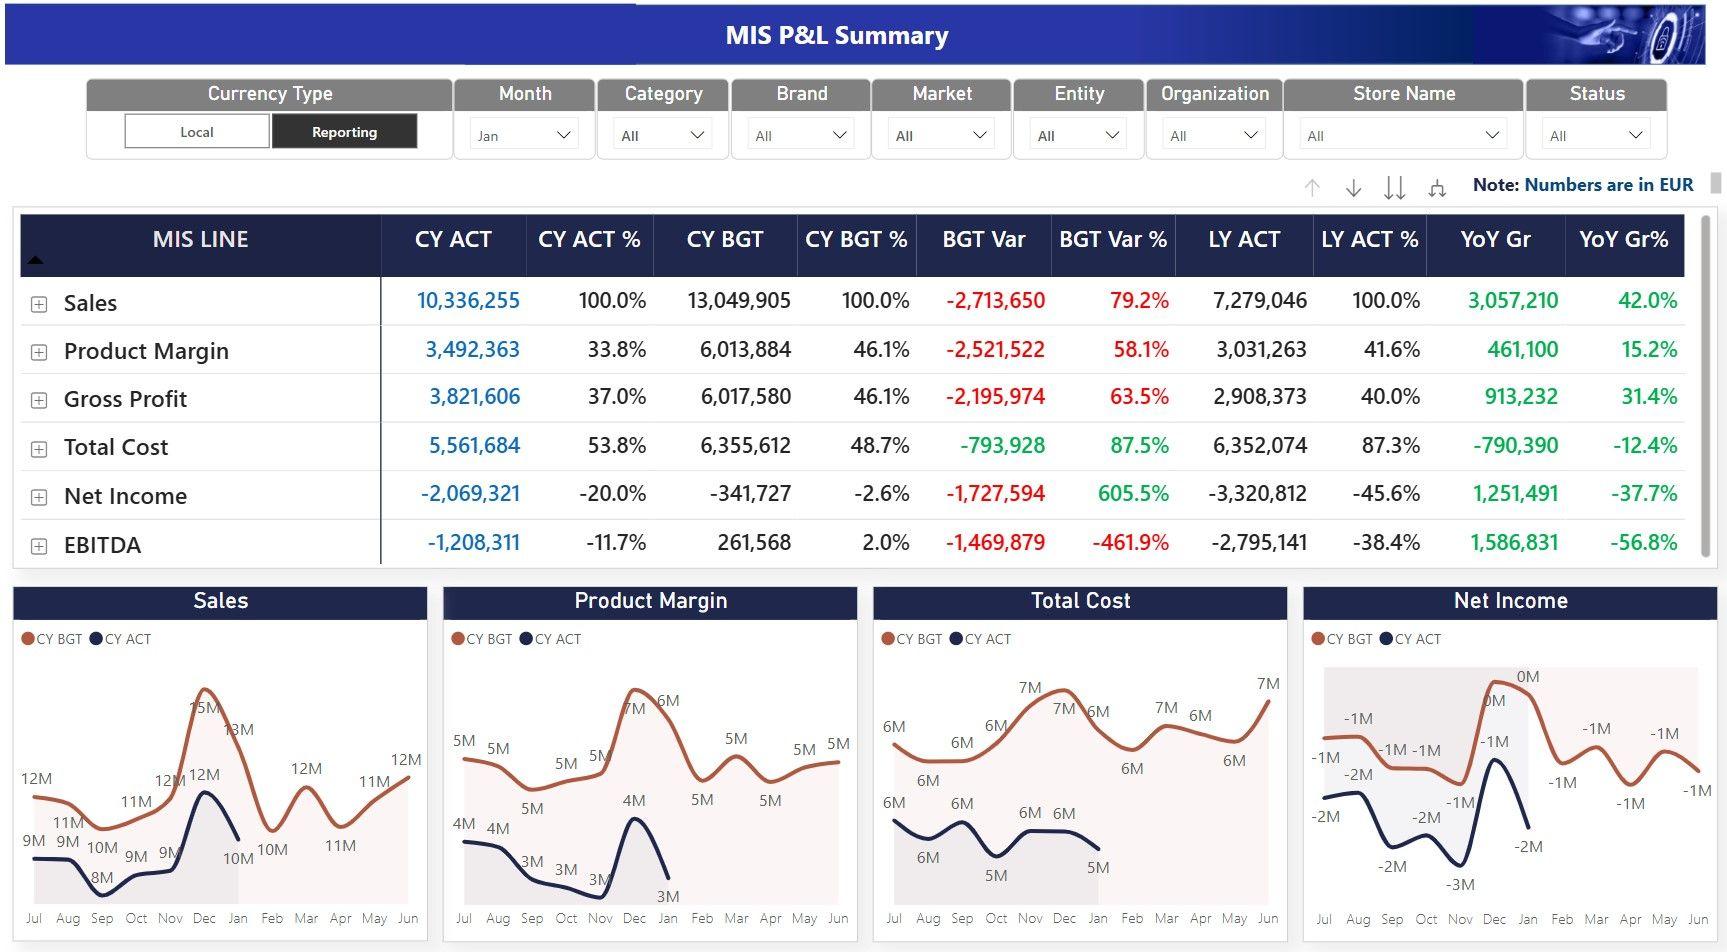
- A central view of sales, margin and budget
- Store metrics such as footfall, headcount and efficiency ratios
- Comparison with budget and prior year
- Live data for regional managers, finance and operations
- Drill-down and filters by store, region, date and product category
The solution
Data consolidation
- POS sales, HR headcount reports and budget spreadsheets combined with Power Query
- Business rules to align sales, HR and budget data
- Dataflows in Microsoft Fabric for reusable, centrally refreshed data
KPIs and calculations
- Daily and monthly sales, budget achievement and year-on-year growth
- Store-wise profitability and sales per employee
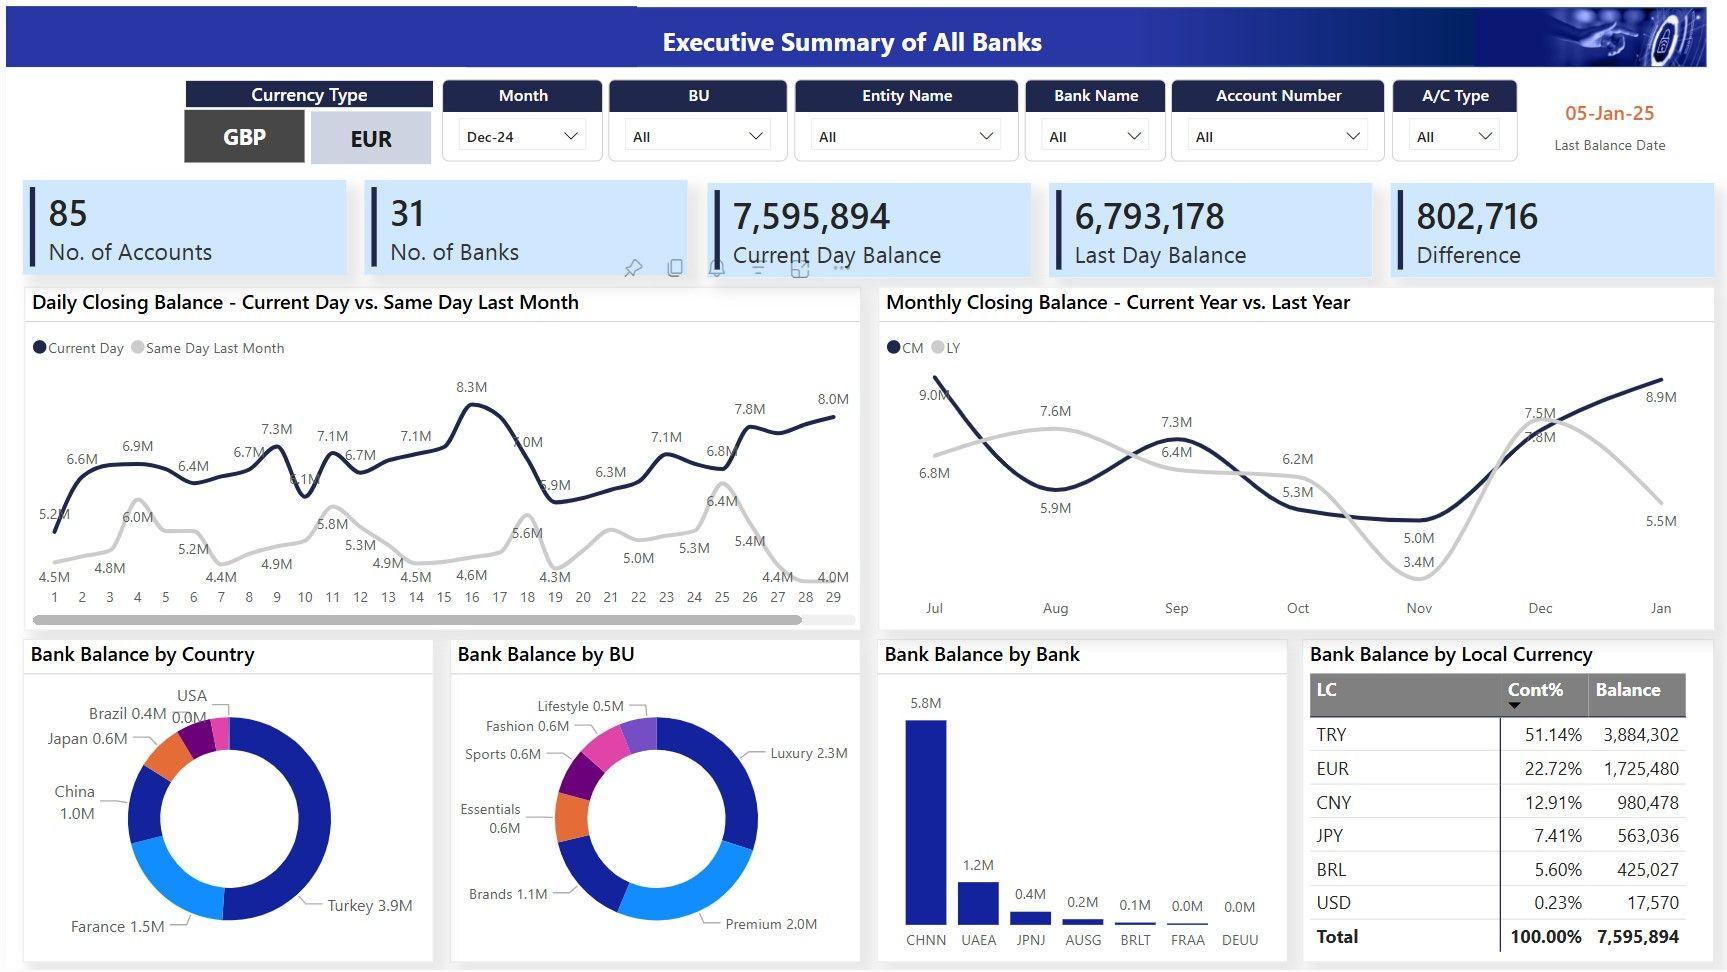
- Performance by brand, country and store format
Dashboard experience
- Drill-down from company level to individual store
- Bookmarks for quick views such as underperforming stores
Outcome
- Real-time visibility across all stores
- Less manual effort and faster report turnaround
- Better budget tracking and automated headcount monitoring
- Better decisions on profitability and store efficiency
“The dashboard has revolutionized our retail operations. We now make decisions based on live data rather than guesswork.”
Tools used
- Power BI
- Power Query
- DAX
- Microsoft Fabric Dataflows