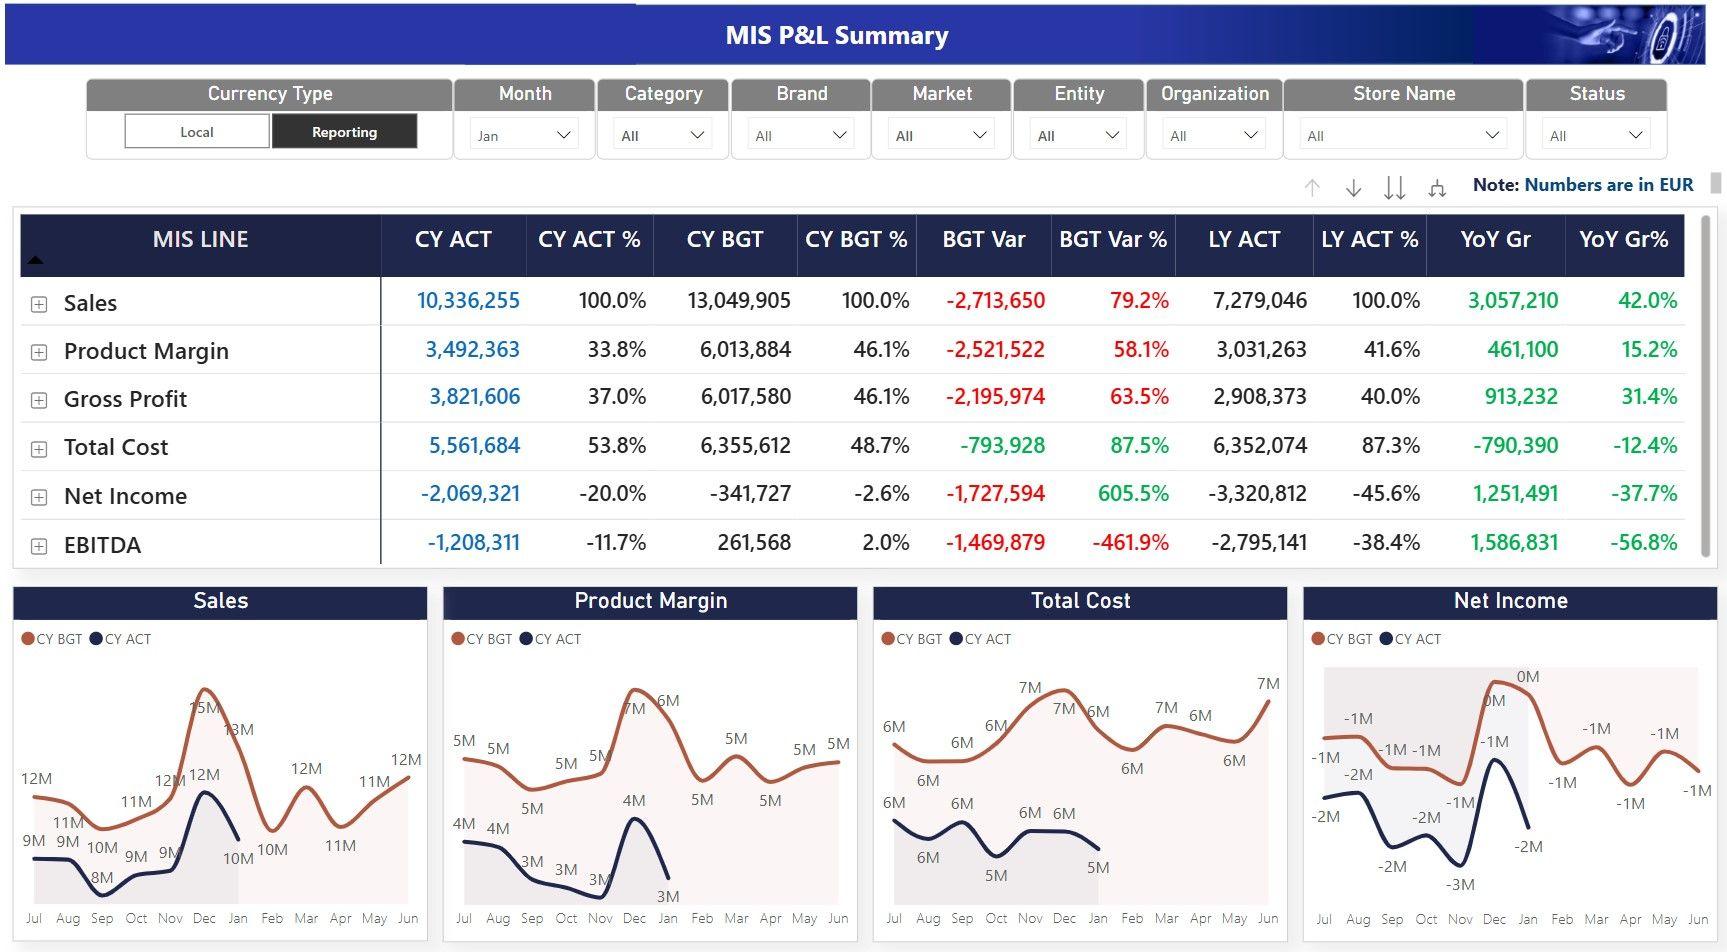
Budget vs actual is the report every finance team asks for first. It looks simple: put the actual numbers next to the budget and show the difference. In practice, it is where many Power BI models go wrong, because budgets and actuals rarely arrive in the same shape.
In this guide I'll walk through the approach I use with clients: how to structure the data, which DAX measures you need, and how to present variances so managers can act on them.
Why budget vs actual is harder than it looks
Three things usually cause trouble:
- Different levels of detail. Actuals come from the general ledger as daily transactions. Budgets are usually monthly, by account and cost center.
- Different meanings of "good". Revenue above budget is good news. Costs above budget are not. A plain "actual minus budget" doesn't tell you which is which.
- Partial periods. In the middle of a month, comparing month-to-date actuals with a full month's budget makes every number look bad.
A good model handles all three, so the report answers the real question: where are we off plan, and does it matter?
Step 1: Keep budget and actual in separate tables
Don't merge the budget into the actuals table. Keep two fact tables and connect both to the same dimension tables:
- Actuals: posting date, account, cost center, amount
- Budget: month, account, cost center, amount
- Shared dimensions: Date, Account (with report line and account type), Cost Center
This is a standard star schema. Because both fact tables share the same dimensions, a single slicer on cost center or account filters both at the same time.
Step 2: Connect the monthly budget to your Date table
Add a date column to the budget table that holds the first day of each month, then relate it to your Date table. The budget now filters correctly by month, quarter and year.
One caution: at day level, the whole month's budget sits on the 1st. For daily views, either keep budget visuals at month level or allocate the budget across days in Power Query.
Step 3: Write the core measures
Start with four simple measures. Everything else builds on them.
Actual = SUM ( Actuals[Amount] )

Budget = SUM ( Budget[Amount] )

Variance = [Actual] - [Budget]

Variance % = DIVIDE ( [Variance], ABS ( [Budget] ) )
Using ABS in the denominator keeps the sign of the percentage meaningful, even when the budget itself is negative.
Step 4: Show favorable and unfavorable correctly
For revenue, a positive variance is favorable. For expenses, it is unfavorable. Store the account type in your Account table and let the measure flip the sign where needed:
Variance Impact =
SUMX (
    VALUES ( Account[Account Type] ),
    VAR Sign = IF ( Account[Account Type] = "Expense", -1, 1 )
    RETURN ( [Actual] - [Budget] ) * Sign
)
Because the measure loops over account types, it also works on subtotals such as Operating Profit, where revenue and expenses are mixed. A positive Variance Impact is always good news, so you can color it green and a negative one red, with no exceptions to explain.
Step 5: Add year-to-date and full-year views
Managers want to see the month, the year so far, and how the year is expected to end.
Actual YTD = CALCULATE ( [Actual], DATESYTD ( 'Date'[Date] ) )

Budget YTD = CALCULATE ( [Budget], DATESYTD ( 'Date'[Date] ) )

Budget Full Year =
CALCULATE ( [Budget], REMOVEFILTERS ( 'Date' ), VALUES ( 'Date'[Year] ) )
If your financial year doesn't end in December, add the year-end date to DATESYTD, for example DATESYTD ( 'Date'[Date], "6/30" ) for a June year end.
Step 6: Compare only closed periods
To avoid comparing half a month of actuals with a full month of budget, limit the budget to the periods that have actuals:
Budget to Date =
VAR LastActualDate =
    CALCULATE ( MAX ( Actuals[Posting Date] ), REMOVEFILTERS () )
RETURN
    CALCULATE ( [Budget], KEEPFILTERS ( 'Date'[Date] <= LastActualDate ) )
Many finance teams go one step further and keep a small "Closed periods" table, so the report only moves forward once the month is officially closed.
Step 7: Design the report for decisions
A few layouts work well again and again:
- A P&L matrix with Actual, Budget, Variance and Variance % side by side, using conditional formatting on Variance Impact
- A variance waterfall that walks from budgeted profit to actual profit, line by line
- Drill-down from company to department to cost center, so managers can find the cause of a variance in a few clicks
- A short commentary box next to the numbers, because a variance without an explanation starts a meeting instead of ending one
Final thoughts
A budget vs actual report is only as good as the model behind it. Keep budget and actuals in separate tables, connect them through shared dimensions, and let a few well-written measures handle signs, periods and subtotals. The result is a report finance teams trust and use every month.
At Tecrionix, we build budget vs actual, P&L and forecasting dashboards for finance teams, and we teach these techniques in our Power BI Training program. To discuss your reporting requirements, contact us.