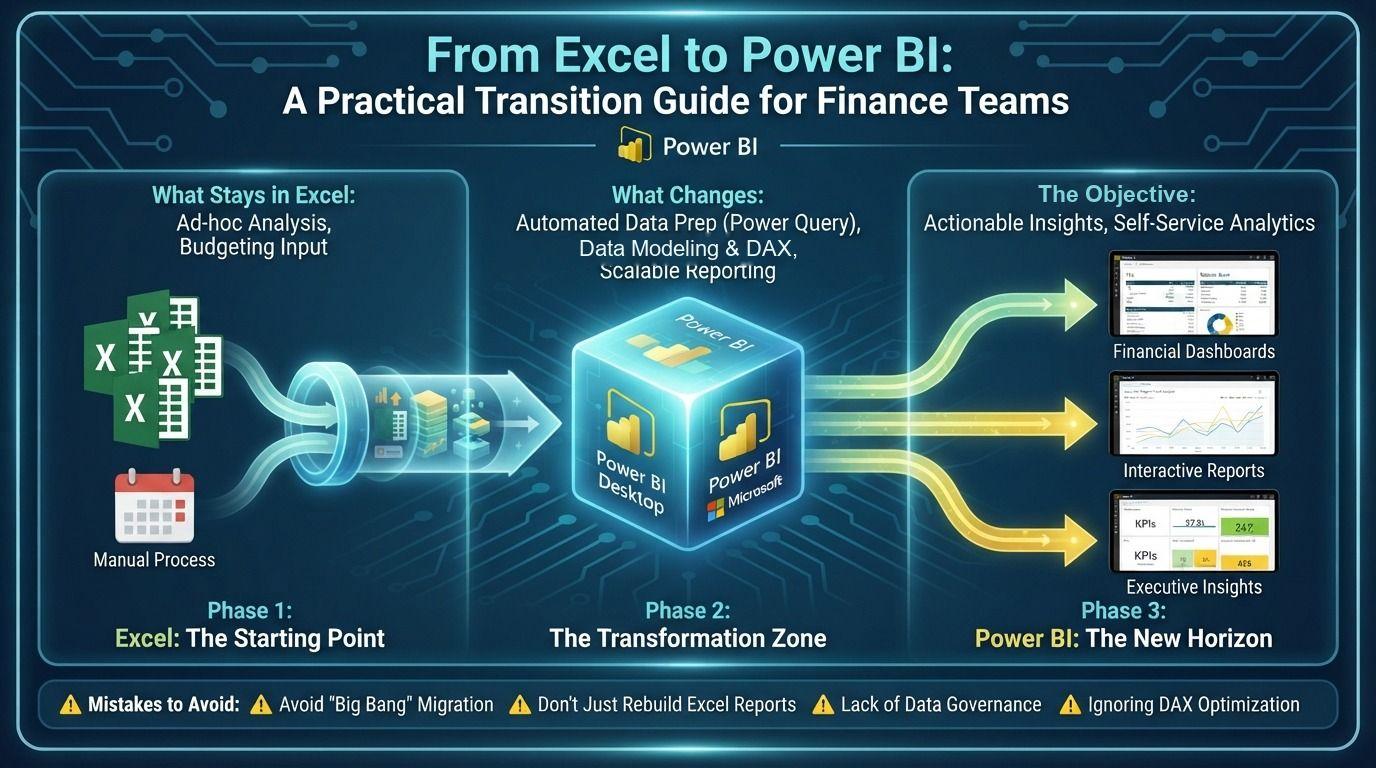
Excel is the finance team's most trusted tool, and for good reason. It's flexible, familiar and on every computer. But when monthly reporting means dozens of linked workbooks, hours of copy and paste, and "which version is the right one?", it's a sign the team has outgrown Excel for reporting.
Power BI is the natural next step. In this guide I'll explain what really changes when you move from Excel to Power BI, what should stay in Excel, and a practical roadmap that avoids the most common mistakes.
Signs you've outgrown Excel for reporting
- Reports take days to prepare, mostly copying and pasting data
- Files are slow, crash, or hit the row limit
- Several versions of the same report circulate by email
- Only one person knows how the workbook really works
- Managers ask for a different view, and it means rebuilding the report
- Errors are found after the report has already been sent
If several of these sound familiar, the issue isn't your team's Excel skills. It's the tool being stretched beyond what it's designed for.
What really changes
From cells to a data model
In Excel, logic lives in cells. In Power BI, data lives in tables connected by relationships, and calculations are measures that work for any filter. A single measure replaces hundreds of SUMIFS formulas.
For example, in Excel you might write a SUMIFS for each region:
=SUMIFS(Sales[Amount], Sales[Region], "East", Sales[Year], 2026)In Power BI, you write one measure:
Total Sales = SUM ( Sales[Amount] )Region, year, product and any other filter come from the report itself: slicers, rows and columns. Change the view, and the same measure gives the right answer.
From copy-paste to refresh
Power Query replaces manual data preparation. You record the steps once, and every month you simply refresh.
From files to a shared report
Instead of emailing attachments, you publish one report that everyone opens in the browser or on their phone, always showing the latest numbers. Row-level security ensures each manager sees only their own area.
What should stay in Excel
Power BI doesn't replace Excel. It replaces Excel as the reporting engine. Excel remains the right tool for:
- Ad-hoc analysis and one-off calculations
- Budget input templates and planning models
- Working papers and reconciliations that need judgment
The two also work together. With Analyze in Excel, users can build pivot tables in Excel directly on top of the Power BI model, using the same trusted numbers. And Excel's own Power Query and Power Pivot are a great stepping stone for teams starting the journey.
A practical transition roadmap
- Start with one high-impact report. Choose a report that takes the most time each month and is used by senior management, such as the monthly P&L.
- Map the sources. List where every number comes from: ERP exports, trial balance, budget files, manual adjustments.
- Rebuild the logic, not the layout. Don't try to copy the Excel report cell by cell. Model the data properly, then design the report around the decisions it supports.
- Validate against Excel. Run both side by side for one or two months until every number ties.
- Publish with clear ownership. Decide who maintains the report, who can see what, and how often it refreshes.
- Train the users. Both the people who build reports and the people who read them.
- Retire the old workbook. Keeping both alive means double work and two versions of the truth.
Then move to the next report. After the first few, the shared data model makes each new report much faster to build.
Common mistakes to avoid
- Recreating Excel in Power BI. Huge tables of numbers with no visuals or drill-down miss the point
- One flat, wide table. Without a proper star schema, measures get complicated and numbers go wrong
- No date table. Time intelligence such as year-to-date and prior year needs a proper Date table
- Skipping validation. One wrong number in the first month can cost the report its credibility
- No training. Without new skills, the team falls back to Excel at the first problem
The skills your team needs
The move is much smoother when the team learns three things:
- Power Query for automated data preparation
- Data modeling for a clean star schema with relationships
- DAX for measures such as variances, year-to-date and ratios
Finance professionals pick these up quickly, because they already understand the numbers. Most of the learning is a new way of thinking, not new mathematics.
Final thoughts
Moving from Excel to Power BI isn't about abandoning Excel. It's about using each tool for what it does best: Power BI for automated, shared, reliable reporting, and Excel for flexible analysis. Start with one report, prove the value, and build from there.
Tecrionix helps finance teams make this move with hands-on trainings and BI consulting. Explore our Power BI Training, our Power Excel Training for teams starting in Excel, or contact us to plan your transition.